Note
Go to the end to download the full example code.
my_example1.py
Here is a plot example
## Lets create some data pandas dataframes have a html representation, and this is captured:
import pandas as pd

df = pd.DataFrame({'col1': [1,2,3],
                   'col2': [4,5,6]})
print( df )
   col1  col2
0     1     4
1     2     5
2     3     6
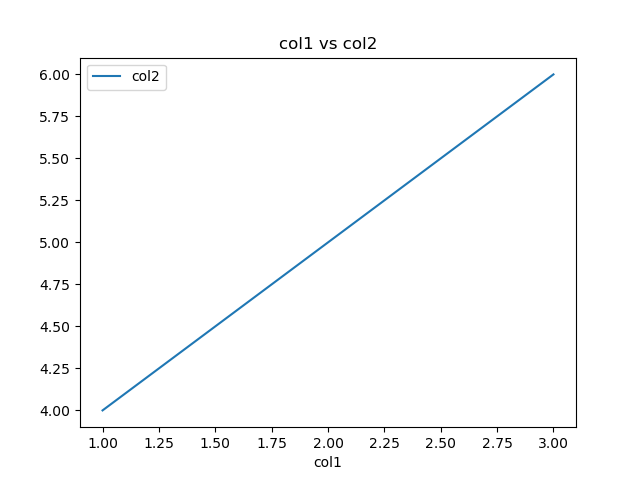
## Lets plot the data
ax = df.plot(x='col1', y='col2', kind='line', title='col1 vs col2')
Total running time of the script: (0 minutes 0.081 seconds)